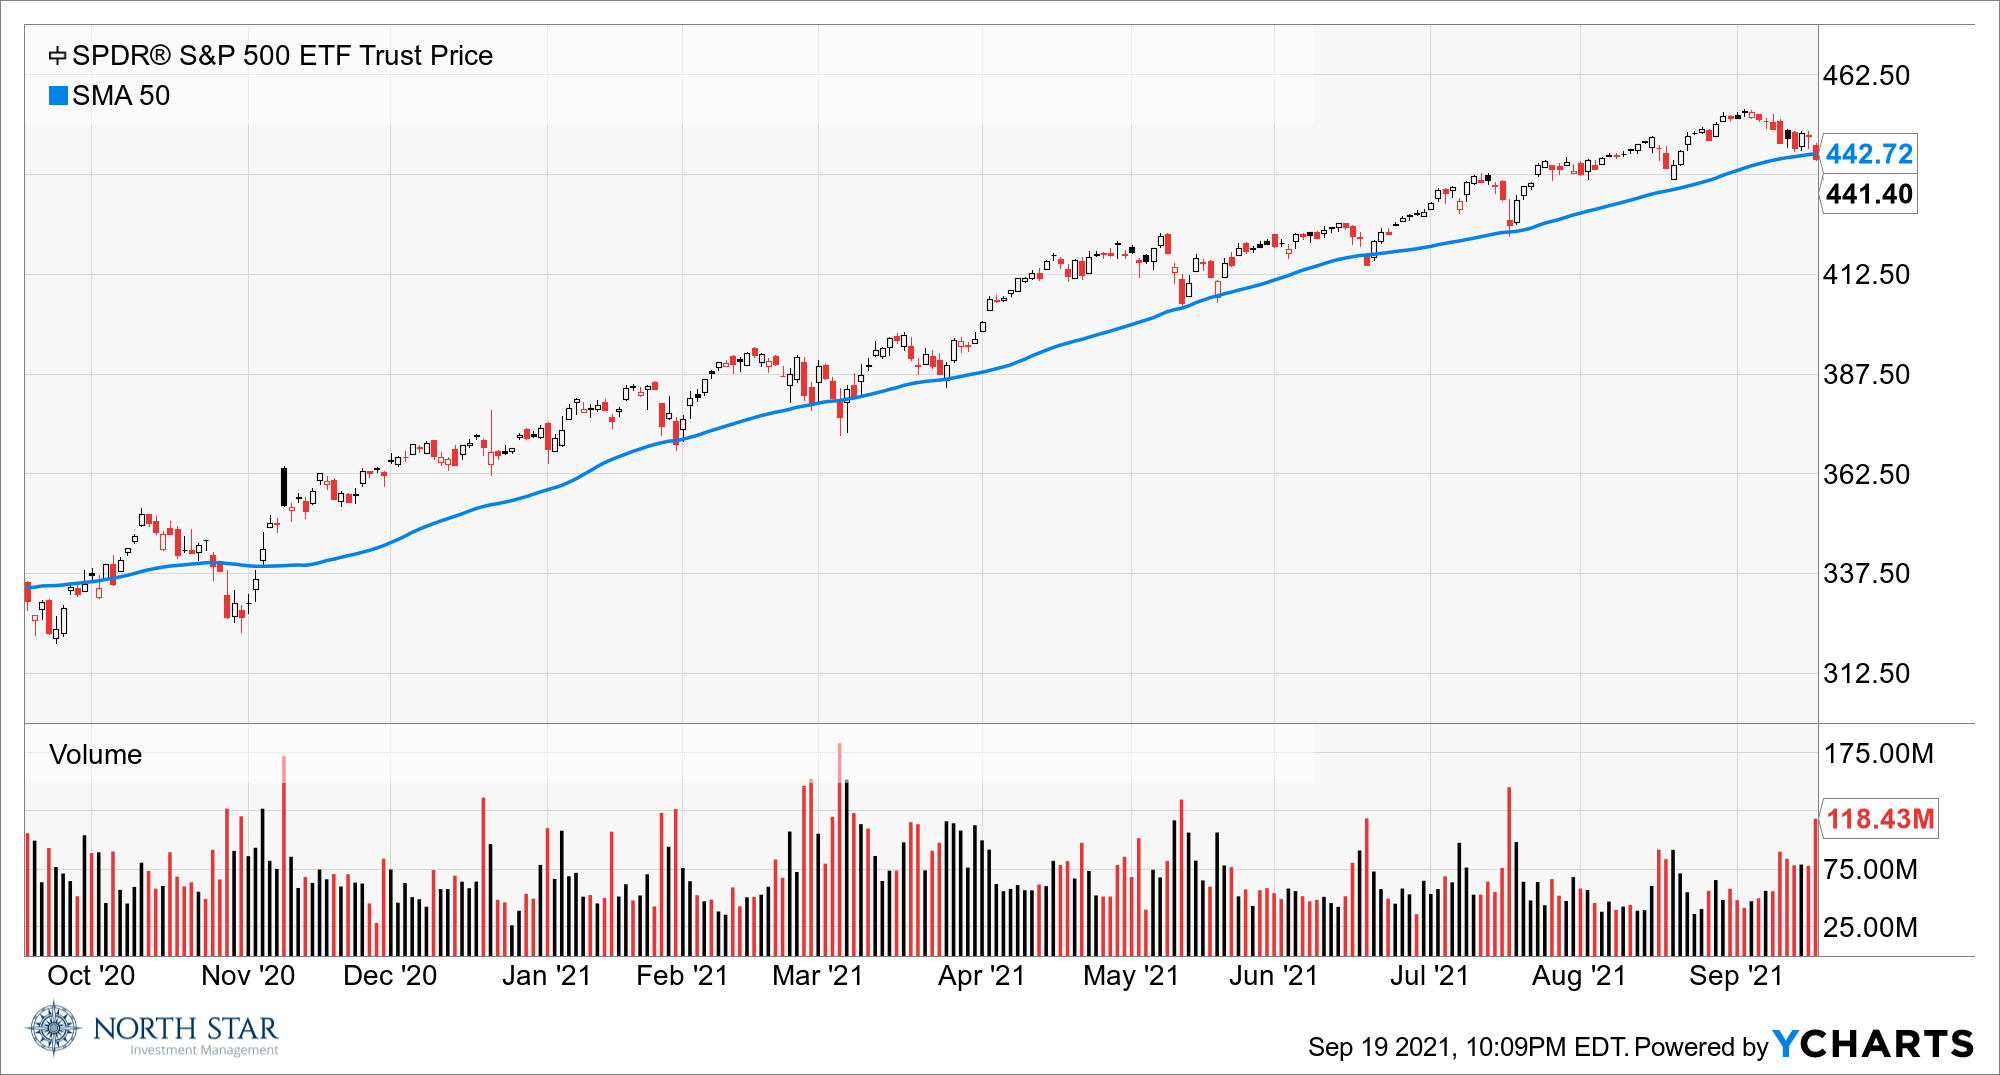
Friend, Foe, or Fiction? The 50-Day Moving Average.
Stocks touched their lowest levels in four weeks Friday, with the S&P 500 closing slightly below its 50-day moving average. Some chart-reading traders have expressed concerns that a key support area has been violated, possibly signaling an upcoming sell-off. The chart below illustrates, however, that over the last twelve months the equity markets have generally snapped back quickly following each breach of the 50-day moving average. Nevertheless, this trading signal combined with mixed economic data should serve as reminders to keep speculation in check. At North Star, we focus our research on fundamental research to determine potential values for each security we invest in, so technical charts such as the S&P 500 50-day moving average, as shown below, do not drive our investment decisions; however, we do use such technical charts to help gauge and consider investor sentiment in our investment work. For example, the Relative Strength Index (RSI) for specific securities helps us gauge whether sentiment is currently overly favorable or overly negative toward a security that we have determined seems attractive based on our fundamental research.

Regarding economic data, The Labor Department reported on Tuesday that consumer prices in August rose 5.3% from a year ago and only 0.3% from July, which was surprisingly low given the surge in producer prices reported the previous week. One possible explanation was that consumer spending was subdued, but then on Thursday, it was reported that retail sales in August rose 0.7% versus expectations for a 0.8% decline and rose 1.8% excluding autos. On Friday, The University of Michigan’s preliminary sentiment index edged up but was still quite low after posting a dramatic decline the previous month. Consumer assessment of the buying conditions for household durables, homes and motor vehicles all fell to the lowest in decades last month due to complaints about high prices.

In addition to rising goods prices, the pandemic continues to dampen economic activity, as the number of active U.S. cases reached its highest level since the onset and daily deaths topped 2,000 for the first time since early March.
The continued partisan bickering in Congress over the $1 trillion infrastructure bill and $3.5 trillion spending plan added to the economic headwinds, as doubts mount over the size and timing of fiscal stimulus.
The S&P 500 finished down 0.57%, while Small Caps gained 0.42%. Trading volume was very heavy because of “quadruple witching”, the simultaneous expiration of single-stock options, stock-index options, stock-index futures, and single-stock futures. The Dollar rallied, while Gold slumped, and the yield on the Ten-Year Treasury increased 3 basis points to 1.37%. A lot of noise, but not a lot of movement.
Soldier Field was noisy on Sunday as the Chicago Bears beat the Cincinnati Bengals 20-17. Bear down!
The Evergrande Effect
Global markets were under pressure Monday as concerns over the possible collapse of China property company Evergrande and overall worries about China’s crackdown on indebted firms unnerved traders. Evergrande is the largest property developer in China, and its financial troubles could lead to a domino effect particularly in Asia. China has changed its policy focus from decades of promoting economic growth to President Xi Jinping’s “common prosperity” plan to address the inequality that has developed. We will be monitoring upcoming Fed comments for any inclusion of concerns about the Chinese property market and the broader Chinese economy, which may cause the Fed to delay less accommodative policy actions such as tapering of quantitative easing or increasing interest rates.
The focus domestically will be on Wednesday’s FOMC monetary-policy decision, with rates certain to stay near zero, but the possibility of a timetable for the Fed to pare its monthly asset purchases from its current $120 billion level. Every attempt to “taper” has been met with a “tantrum” from stock and bond investors over the last eight years.
The economic calendar is concentrated on housing data, which is unlikely to move the markets. Outside of housing data, the Leading Economic Index for August is expected to show a 0.5% month-over-month rise, slowing from a 0.9% rise the month earlier.
Stocks on the Move
+28.0% ARC Document Solutions Inc (ARC) provides large format document reproduction and printing services, mainly to architectural, engineering, building operator, and construction firms. There was no significant company news last week.
ARC is a 1.6% position in the North Star Micro Cap Fund.
