
Robust Rally
A robust rally on Friday erased the losses from earlier in the week, with high-profile tech stocks leading the bounce. Netflix Inc (NFLX) surged 8.5% after gaining more subscribers than expected, and Alphabet Inc (GOOGL) added more than 5% after Google announced plans to cut 12,000 employees. The Nasdaq was the top performing index for the week, adding 0.5% in its third positive week in a row, while the S&P 500 edged 0.6% lower and the Russell 2000 retreated 1%.
The economic data continued to paint a picture of decelerating inflation and activity. New York state manufacturing contracted sharply in January as orders collapsed and employment growth stalled. The New York Fed’s “Empire State” Index on current business conditions plummeted to -32.9 this month from -11.2 in December, the lowest level since May 2020 and the fifth worst reading in the survey’s history. Producer prices for final demand in the US dropped 0.5 percent from a month earlier in December 2022. It was the largest monthly decline since April 2020, adding to signs that inflationary pressure in the world’s largest economy is cooling. Nevertheless, Fed officials continued their hawkish language as St. Louis Fed President James Bullard argued Wednesday for the central bank to take a different approach by continuing to rapidly raise the fed-funds rate until it is above 5% to prevent a resurgence of inflationary pressures. Then on Thursday Fed Vice Chair Lael Brainard, speaking at the University of Chicago Booth School of Business (go Maroons), stated “Even with the recent moderation, inflation remains high, and policy will need to be sufficiently restrictive for some time to make sure inflation returns to 2% on a sustained basis.”
The bond market reinforced the slowdown message, with the 10-year Treasury slipping 2 basis points to 3.49%, a level which is inconsistent with a forecast for sustained inflation.
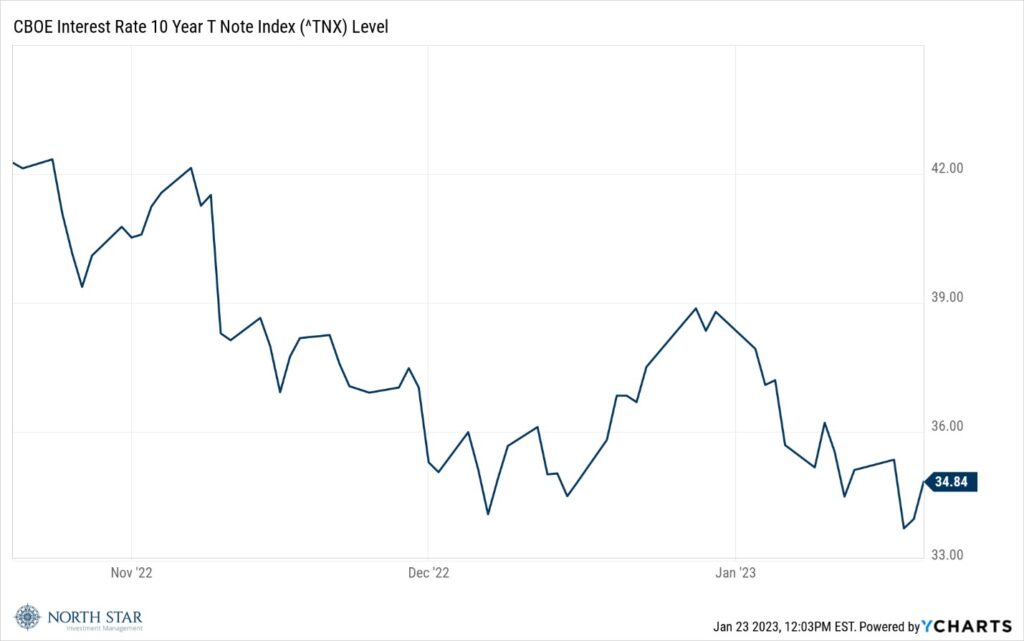
The yield has now declined more than 75 basis points over the last three months.
Earnings season is off to a shaky start, with the S&P Index reporting a 4.6% blended (already reported and forecasted) decline for the fourth quarter, compared to an earnings decline of -4.0% last week and an earnings decline of -3.2% at the end of the fourth quarter (December 31). Negative surprises from the Financial sector accounted for most of the decline, although as we highlighted in last week’s commentary, most of the earnings misses from the big banks came from their increases in non-cash loan loss reserves to provide a cautionary cushion.
The dollar finished marginally lower, while gold inched higher. Crude oil continued to trade around $80 per barrel, gaining approximately 1.5% for the week. The Oil and Gas sector was the only group besides the Tech sector that was positive, while the Telecommunications and Utilities sectors were most negative with losses around 3%.
We still favor the Financial sector, small caps, gold, and believe that the beaten-up Consumer Discretionary companies have significant rebound potential.
What National Debt Metric Matters, and When to Be Concerned
Besides corporate earnings reports, the biggest financial news of the past week was the ongoing U.S. federal debt limit discussions in Congress.
The wrong debt metric usually makes headlines, but conventional wisdom rarely is. National debt as a percentage of Gross Domestic Product (Debt-to-GDP) is frequently cited in the financial press. But national debt is not paid for (interest and principal) with GDP, which is the value of all final-user goods and services. Instead, national debt is paid for with tax revenues. In our view, the more important debt metric is annual interest payments on the national debt as a percentage of government tax revenues, which is known in economic circles as “interest burden”, and the U.S. is in good shape based on this metric…at least for now.
While Debt-to-GDP trends make lot of hyperbolic headlines, interest burden trends are much more relevant to assessing economic conditions in a given nation. As seen in the below graph, derived from the FRED database of the St. Louis Federal Reserve, the national debt interest burden recently has been below 10% of annual federal tax receipts. This current level is not a problem, but could be if: (1) the average interest rate on U.S. debt rises significantly, which could happen gradually as previous borrowings mature and that debt must be refinanced at potentially higher interest rates – but all U.S. debt does not mature at the same time, so a 1% increase in prevailing interest rates does not result in an immediate 1% increase in annual interest expense; or (2) a significant economic event, such as the Great Recession in the 2008-2009 period or the Covid pandemic, causes U.S. national debt to increase significantly at the same time that U.S. federal tax receipts decline. Therefore, while less interest burden allows for more federal spending on other fronts or for debt reduction, the chart below suggests the current interest burden is quite manageable.
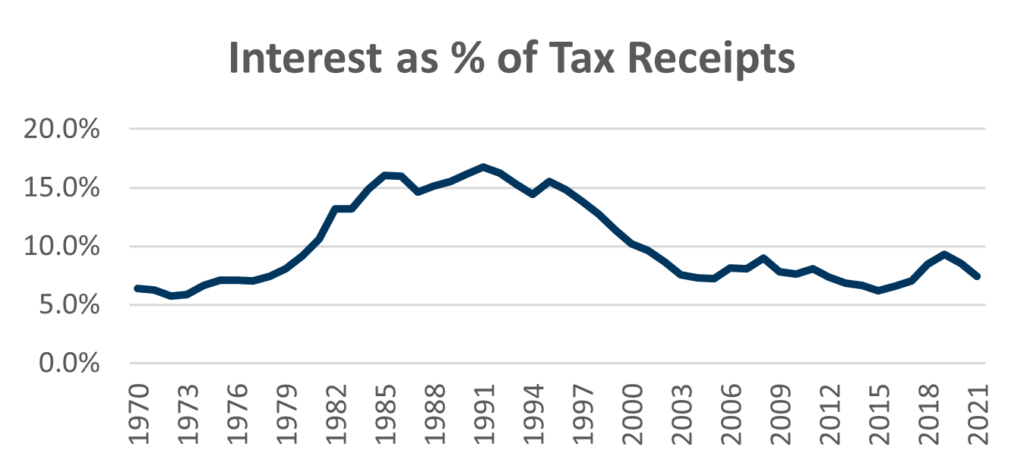
Source: Federal Reserve Bank of St. Louis Economic Research
The graph above only reflect interest on U.S. issued debt and excludes the interest payments received from foreign bonds that the U.S. Treasury owns, which are worth several trillions. As such, net interest as a percentage U.S. tax receipts is even lower than shown in the graph.
Soft Sentiment
Earnings reports will dominate the conversation next week with 93 S&P 500 companies scheduled to report results for the fourth quarter, including Tesla Inc (TSLA), Microsoft Corp (MSFT), Visa Inc (V), Mastercard Inc (MA), Johnson & Johnson (JNJ), and The Boeing Company (BA). Federal Reserve speakers will be in a blackout period ahead of the February FOMC meeting, so we will have a respite from the relentless negative jawboning. The economic reports will include updates on the S&P Case-Shiller Home Price Index, new home sales, durable goods orders, and consumer sentiment, all of which are likely to reinforce the picture of a softening economy.
Stocks on the Move
-10.3% 1-800-Flowers.com Inc (FLWS) is an e-commerce provider of floral products and gifts. The Company’s product offerings include fresh-cut and seasonal flowers, plants, floral arrangements, home and garden merchandise, and gift baskets. There was no significant company news last week.
The stocks mentioned above may be holdings in our mutual funds. For more information, please visit www.nsinvestfunds.com.