
Inversion Diversion
Some market prognosticators believe that the stock market climbs any “wall of worry.” If that is true, then the stock market is going much, much higher. Ironically, despite all the supply-chain issues globally, so far in 2022 there have been no shortage of bricks for the metaphorical “wall of worry.”
The U.S. yield curve extended its recent flattening after another strong employment report on Friday increased the probability that the Federal Reserve will bump rates 50 basis points in May, as well raise rates at least six more times this year. The cacophony of concern from the recession Casandras created a short-lived sell-off when the 2-Year and 10-Year Treasury yields inverted for the first time since 2019, as the 10-Year yield actually dropped 11 basis points to 2.38%. Despite the technically driven twist and turns, for the week the S&P barely budged gaining 0.06% while the Nasdaq gained 0.65% and the Russell 2000 added +0.63%. Oil and Gas stocks fared the worst, declining 3.10%, as Crude posted its biggest weekly loss in more than 10 years after the Biden administration ordered the largest release of U.S. strategic reserves ever in an effort to combat the surging prices at the pump.
We Love the Rise of Technical Analysis…In Our Own Way
As fundamental value investors, we constantly compare likely future free cash flows of businesses to cash flows of other businesses, as well as to investment opportunities such as government bonds, corporate bonds, and preferred stock. However, we think it is important to be aware of any factors that influence stock prices. Technical analysis has risen in popularity during the past two decades as traders attempt to interpret price movements of investment securities to determine possible meaningful trends that may persist or cease. A few technical analysis indicators have become extremely popular for discussions and written commentary, especially: (1) the spread between the yield on 2-Year U.S. Treasuries and 10-Year U.S. Treasuries as a possibly recessionary indicator; and (2) the divergence or convergence of 50-day and 200-day price level moving averages of individual securities and various market indices.
These two popular technical indicators have been in the spotlight very recently. During the last week the Two-Year U.S. Treasury Yield rose above the 10-Year U.S. Treasury yield resulting in the oft-mentioned yield inversion status that technical analysts believe forewarns of recessionary economic conditions. The logic behind this “yield curve inversion” theory is that the lower yield of a longer-term 10-Year U.S. Treasury implies that a rational investor prefers a guaranteed lower long-term annual return with predictable payouts to a higher yield short-term guaranteed higher annual return; supposedly this is only rational if economic prospects are likely to worsen in future periods, such that a lower guaranteed nominal return is preferable to a higher shorter-term annual rate of return. The following chart shows the recent trend in this financial market-based indicator. The negative difference between the 10-Year Treasury Yield and the 2-Year Treasury Yield indicates an inverted yield curve.
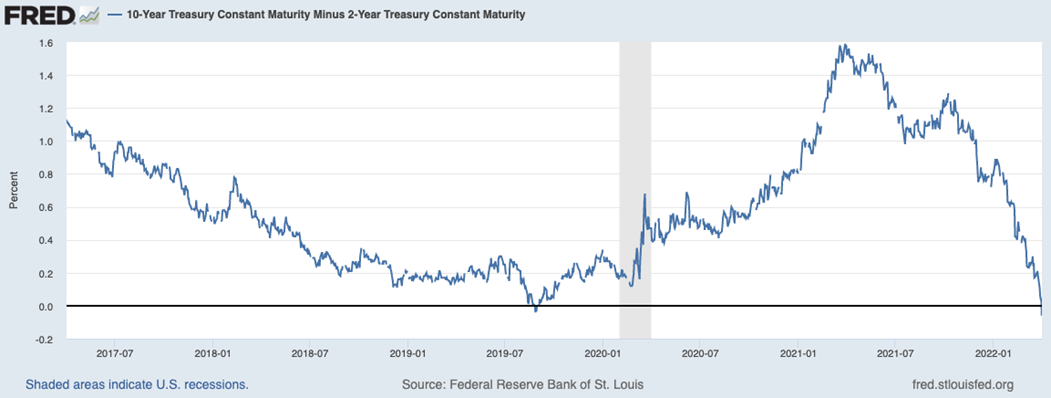
Whereas a recession has followed in five of the previous six times the yield curve has inverted, we believe this time is different (famous last words), because yields across all maturities have been distorted by the extraordinary monetary policy tools that have been used in response to the pandemic.
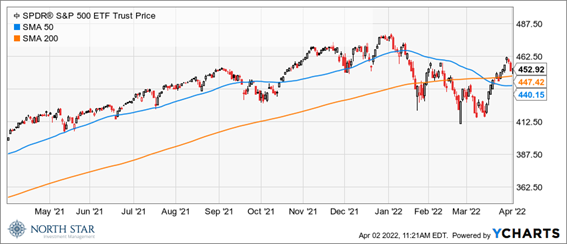
In addition, two weeks ago, Barron’s weekly publication highlighted the so-called “Death Cross” technical indicator, shown in the chart below. Barron’s stated: “The S&P 500 has performed poorly this year, down about 6.4%. This past Monday, it got scary in a Harry Potter sort of way: The benchmark experienced a death cross. A death cross occurs when the S&P’s 50-day moving average slips below its 200-day average. This one saw the S&P’s 50-day average drop to 4465, below the 200-day 4467. This suggests something is awry in stocks, not a surprise. In normal times, particularly when stocks are rising, the average of recent prices is higher than the 200-day average, which includes prices at lower levels.” Such widely followed technical indicators frequently create short-term bearish market sentiment that can lower valuations across broad swaths of stocks, and our portfolios are not immune from such short-term mark-to-market fluctuations. However, our free-cash-flow analysis and discounted-cash-flow fair value methodologies enable us to exploit such technically driven valuation opportunities.
Thus, despite our fundamental approach to security analysis we see value in technical awareness because it can help our North Star research team understand why stocks of businesses with consistent and predictable free cash flows might be somewhat arbitrarily re-valued at lower price levels than warranted, thus creating likely temporary opportunities for North Star to add to positions in such stocks. The recent heightened volatility of financial markets has created numerous such opportunities.
Gearing Up for Earnings Season
The slope of the yield curve and the other technical indicators will continue to capture the imagination of stock traders. Meanwhile, developments in the war and the pandemic will remain of the greatest significance.
Earnings season is set to commence, and it is likely to contain a great deal of cautionary rhetoric. The growth in corporate earnings will slow from its recent torrid pace, with a current blended earnings growth estimate of 6.1%, and only 1.0% if the energy sector is excluded.
During the quarter, analysts decreased earnings estimates for companies in the S&P 500 for the quarter by 0.7% (to $51.83 from $52.21). In a typical quarter, analysts usually reduce earnings estimates during the quarter. In fact, during the past 15 years the average decline in the bottom-up EPS estimate during a quarter has been 4.8%. Whereas the decline in the bottom-up EPS estimate recorded during the first quarter was actually smaller than average, it did mark the first decrease in the bottom-up EPS estimate during a quarter since Q2 2020 (-37.0%), when there were widespread lockdowns in the U.S. due to COVID-19.
There has also been a significant disparity between different sectors, as eight of the eleven sectors witnessed a decrease led by the Industrials (-11.4%) and Consumer Discretionary (-10.8%) sectors. On the other hand, three sectors recorded an increase in their bottom-up EPS estimate for Q1 2022 during this period, led by the Energy (+32.4%) sector.
While analysts were decreasing EPS estimates in aggregate for the first quarter, they were also increasing EPS estimates in aggregate for the next three quarters suggesting a delay rather than a decline in the projected earnings growth path. The EPS estimate for the second quarter increased by 1.6%, the EPS estimate for the third quarter increased by 2.4%, and the EPS estimate for the fourth quarter increased by 3.9%. Summing up the year, the EPS estimate has increased by 2.0% from December 31 to March 31.
The economic calendar is light with updates on factory orders, the Purchasing Managers Index, trade balance and jobless claims, all unlikely to move the markets. On Wednesday, the FOMC will release the minutes from its last meeting, which will certainly be over-analyzed for new clues concerning the path for future rate hikes and balance sheet unwinding.
Stocks on the Move
Despite all the intraday volatility, we had no double-digit price movements in any of our holdings. Blue Bird Corp (BLBD) declined 9.6%, despite seemingly having the best news release during the week with Modesto City schools ordering 30 electric school buses, Blue Bird’s single largest order for zero-emission buses from a school district. ROTH analyst Craig Irwin estimates the order is worth almost $11.0M.
Farewell to Coach K. In what seems like poetic symmetry, the arch nemesis North Carolina Tar Heels were the first team, and 42-years later, the last team to beat Coach K’s Duke Blue Devils. We hold a minor grudge against Kansas Coach Bill Self for deserting the Illini after the 2003 campaign, and Hubert Davis seems like a nice guy….so go Tar Heels!
The stocks mentioned above may be holdings in our mutual funds. For more information, please visit www.nsinvestfunds.com.